DashHarbor Features
EmDash Monitoring
Coming soon
Your website can look perfectly healthy right up until someone tries to use it. DashHarbor's managed monitoring approach checks website availability, application health and the services that keep your EmDash site running. When something needs attention, the goal is to detect it, identify the problem and make sure it gets investigated.
Know when something breaks. Preferably before your customers do.
Your website can look perfectly healthy right up until someone tries to use it. DashHarbor's managed monitoring approach checks website availability, application health and the services that keep your EmDash site running. When something needs attention, the goal is to detect it, identify the problem and make sure it gets investigated.
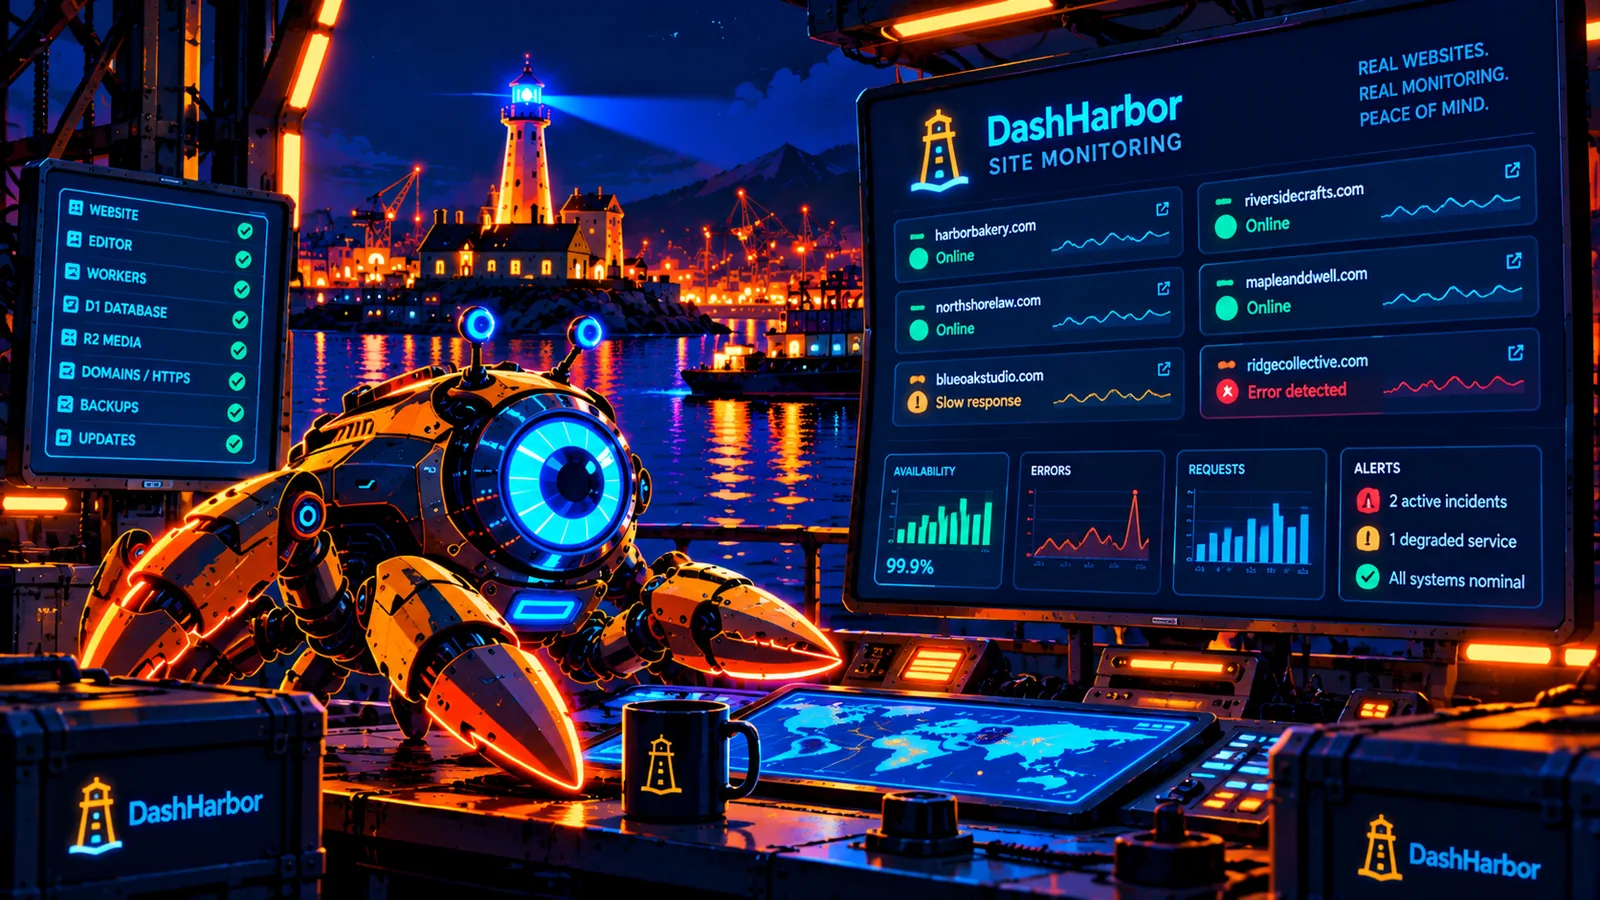
Your website doesn't have to disappear to be broken
Sometimes websites fail spectacularly.
The homepage disappears. Every link returns an error. Visitors are greeted by something that looks suspiciously like a server having a nervous breakdown.
At least those problems are obvious.
The more troublesome failures are often quieter.
A contact form stops submitting. Images disappear from important service pages. The website loads normally, but the EmDash editor won't open. A configuration change breaks one section of the site while everything else continues working.
You might not notice for days.
And if your website generates business inquiries, those days can matter.
Website monitoring is about finding problems before they become unnecessarily expensive surprises.
DashHarbor already uses operational health checks as part of managing its hosting platform. The expanded paid monitoring service builds on that foundation with recurring customer-site checks, meaningful alerts, incident records and clearer visibility into website health.
The idea isn't to fill your dashboard with graphs nobody understands.
It's to answer three practical questions:
- Is my website working?
- If something goes wrong, will anybody notice?
- What happens after a problem is detected?
Those are reasonable questions for anyone paying somebody else to manage their hosting.
What is EmDash website monitoring?
Website monitoring is the process of checking whether a website and its supporting services are functioning as expected.
The simplest form is an availability check.
A monitoring service requests a URL, examines the response and records whether the website appears to be online.
That's useful, but it only tells part of the story.
A server can return a successful HTTP response while displaying an error message inside the page. A homepage might load correctly even though the editor is broken. A website can respond quickly while its most important form quietly fails.
Useful monitoring therefore looks beyond a single response code.
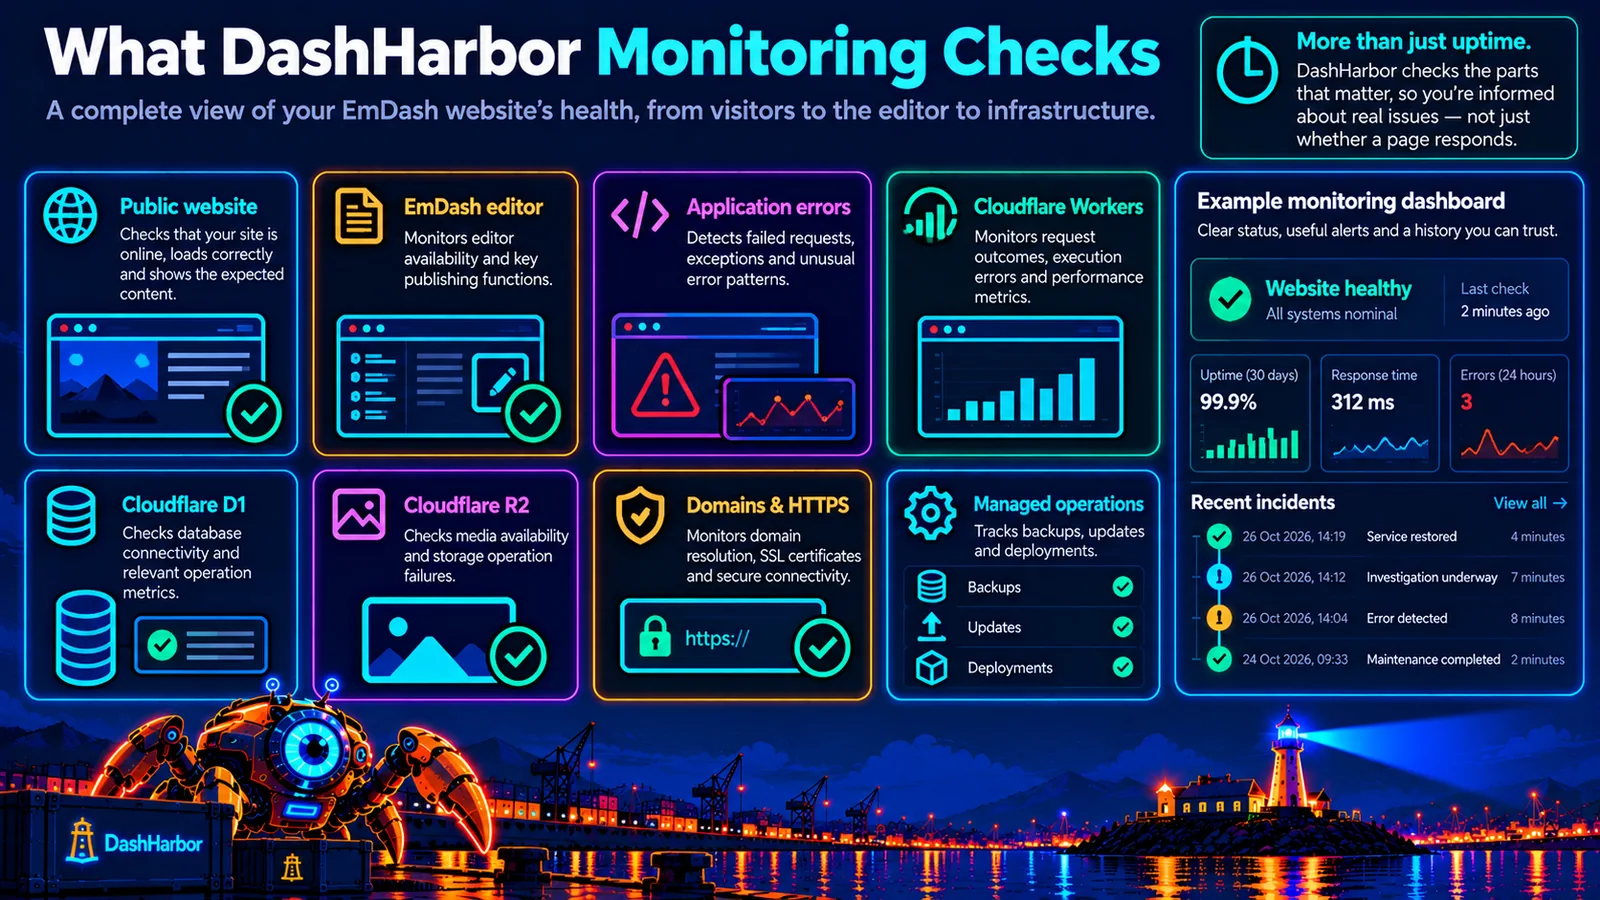
For an EmDash website hosted on DashHarbor, monitoring can involve several layers:
Availability monitoring: Checking that the public website responds correctly.
Application monitoring: Identifying errors, failed requests and unusual behavior in the application.
Functional monitoring: Checking that important website functions behave as expected.
Infrastructure monitoring: Looking for problems involving the underlying Cloudflare services and their connections.
Operational monitoring: Tracking the outcome of managed tasks such as backups, updates and deployments.
Each layer provides different information.
Together, they give a more useful picture of website health than a green dot next to the word *Online*.
Why HTTP 200 doesn't always mean everything is fine
HTTP status codes are one of the first things monitoring systems examine.
A 200 OK response generally indicates that a request was handled successfully.
A 404 means the requested resource wasn't found. A 500 indicates a server-side problem.
That's a good starting point.
But a successful response doesn't prove the website is functioning properly.
Imagine visiting a restaurant where the front door opens, the lights are on and somebody welcomes you inside.
Wonderful.
Unfortunately, the kitchen has burned down.
Technically, the restaurant is open. You're still not getting lunch.
A website can behave much the same way.
The homepage may return HTTP 200 while a database-dependent section fails to render. The application may send a successful response containing the wrong content. A form might display a reassuring confirmation without successfully processing the submission.
A more useful monitoring system combines basic availability checks with checks that understand something about the application.
For example:
- Does an important page return the expected response?
- Is the content that identifies the page actually present?
- Can the application reach required services?
- Are error rates rising?
- Are critical editor functions available?
- Have recent background operations completed successfully?
Not every website needs every possible check.
The goal is to monitor the functions that matter, without inventing complexity for the sake of a prettier dashboard.
What should DashHarbor monitor?
An EmDash website on DashHarbor can use Cloudflare Workers for application execution, D1 for structured data and R2 for uploaded media.
Those components work together, but they can also experience different kinds of failure.
A useful monitoring service needs to distinguish between them.
Monitoring area | What gets checked | Why it matters |
|---|---|---|
Public website | Availability, expected responses and important page content. | Detects when visitors cannot access the website correctly. |
EmDash editor | Availability and selected safe application-health checks. | Helps identify publishing problems even when public pages still load. |
Application errors | Failed requests, exceptions and unusual error patterns. | Reveals problems that may affect only particular operations. |
Cloudflare Workers | Request outcomes, execution errors and relevant performance signals. | Helps diagnose application and deployment problems. |
Cloudflare D1 | Relevant database metrics and safe connectivity checks. | Identifies issues affecting content or data-dependent functionality. |
Cloudflare R2 | Relevant storage-operation failures and media availability. | Helps detect missing or inaccessible uploaded assets. |
Domains and HTTPS | Domain resolution, secure connectivity and certificate-related failures. | Identifies problems preventing visitors from reaching the correct site securely. |
Managed operations | Backup, update and deployment outcomes. | Detects failed maintenance tasks that might otherwise go unnoticed. |
These are the intended areas of the expanded managed monitoring service, not a claim that every check is already exposed in the customer dashboard.
Monitoring should also distinguish between a confirmed failure and a temporary anomaly.
One slow request doesn't necessarily mean the website is broken.
A series of failed requests accompanied by application errors is a different matter.
That distinction becomes important when deciding whether to generate an alert.
How DashHarbor website monitoring works
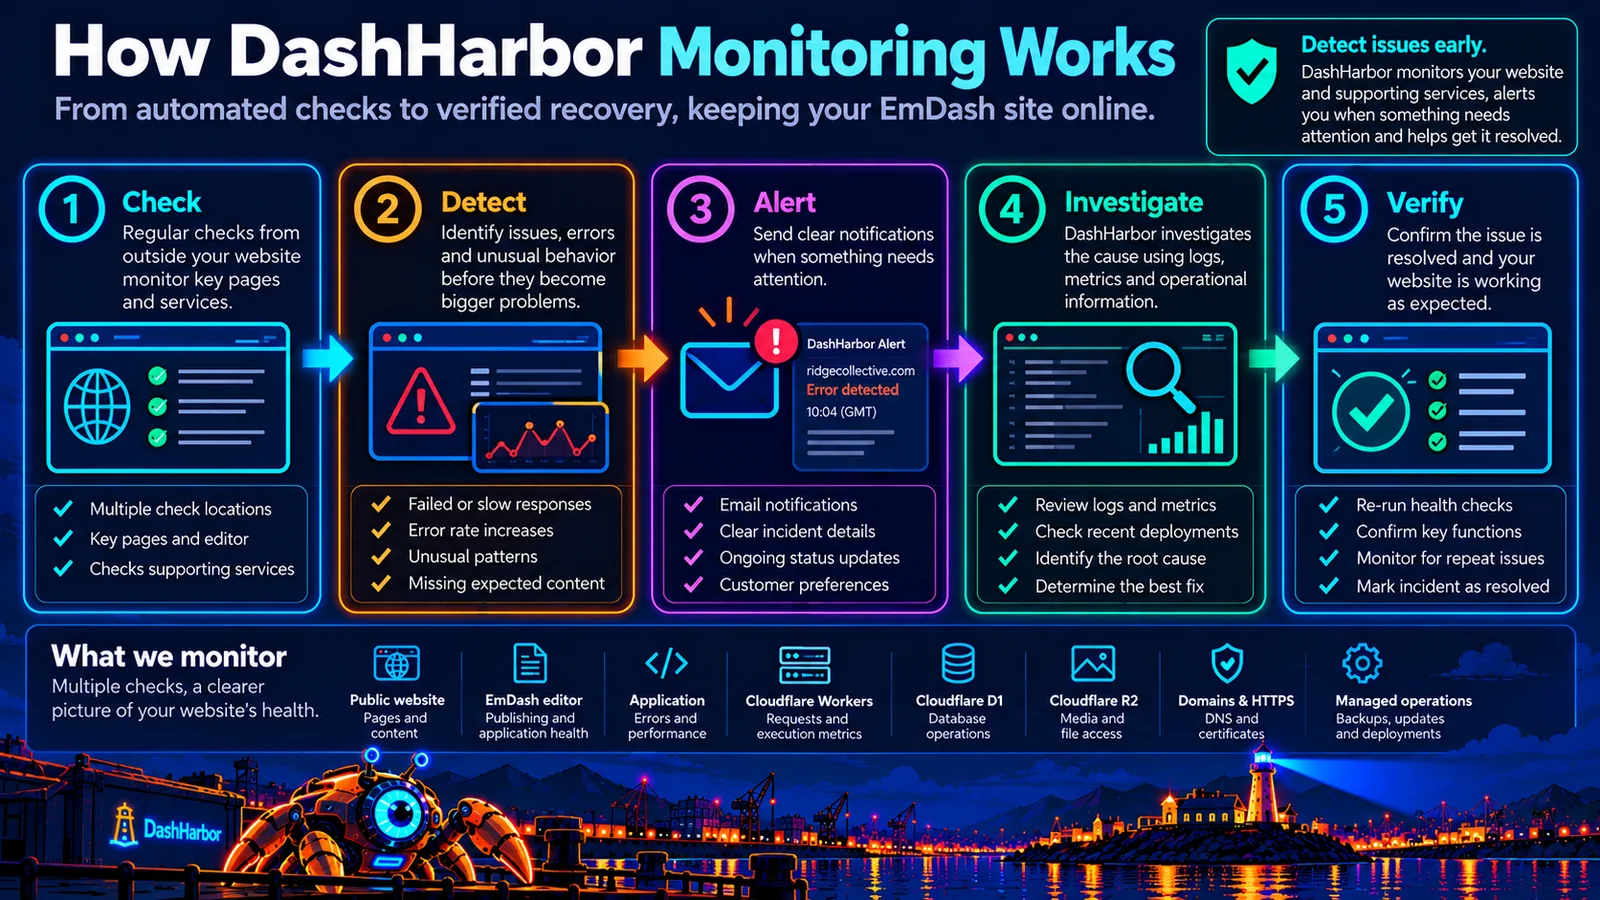
DashHarbor's intended monitoring workflow follows five stages:
Check → Detect → Alert → Investigate → Verify.
The goal is to turn raw technical signals into something useful.
1. Check the website and its services
Monitoring begins with recurring checks against the relevant website and infrastructure.
For public availability, those checks should run independently of the website being monitored.
That independence matters.
If a website stops responding, a monitoring process running inside the broken application might stop responding too.
Not especially helpful.
An external check can detect that failure because it doesn't depend on the affected website being healthy.
Other signals may come from the hosting platform itself, such as application errors, Worker execution metrics or the results of managed operations.
Together, these checks provide information about the website's current condition.
2. Detect unusual or failed behavior
A single failure doesn't always justify an emergency notification.
Networks occasionally experience brief interruptions. Requests time out. A particular connection fails while others succeed.
A monitoring system needs rules for deciding when something represents a genuine incident.
That can involve repeated failures, changes in error rates, missing expected responses or failed critical operations.
For example, one unsuccessful request might trigger another check.
Repeated failures could move the website into a degraded or unavailable state.
A serious confirmed application error might warrant more immediate attention.
The objective is to catch meaningful problems without treating every passing hiccup as the end of civilization.
3. Generate a useful alert
Once the system identifies a problem, somebody needs to know about it.
DashHarbor monitoring includes customer notifications and alerts for the people looking after the service.
A useful notification should explain:
- Which website is affected.
- What type of problem was detected.
- When the issue was first observed.
- Which checks or signals indicate a failure.
- Whether the problem is ongoing or has cleared.
- What action, if any, is required from the customer.
Email is a natural starting point for customer notifications, with additional notification options possible as the service develops.
Different incidents also deserve different levels of attention.
A temporary performance issue shouldn't necessarily generate the same response as a website becoming completely unavailable.
Good alerting is about getting the right information to the right person, not making everybody's inbox miserable.
4. Investigate the underlying problem
An alert identifies a symptom.
Investigation establishes what caused it.
A public website returning errors might be experiencing an application exception, a configuration problem, a database-related failure or an issue outside the application itself.
DashHarbor's managed monitoring approach connects alerts with the operational information needed to investigate them.
That might include reviewing recent deployments, relevant logs, failed requests, service metrics or the outcome of an update.
The information helps determine whether the problem requires a configuration correction, application fix, deployment rollback or wider recovery operation.
The important thing is identifying the cause before applying a solution.
5. Verify that the problem is resolved
Monitoring shouldn't stop being useful the moment someone starts investigating.
After a corrective action, the relevant checks need to confirm that the website is working again.
If the public site was unavailable, the availability checks should pass.
If an application error affected publishing, the relevant editor functions should be checked.
If missing media was the problem, the restored files should be accessible.
The incident can then be marked as resolved, with an appropriate record of the original failure and recovery.
A monitoring alert is useful. A verified resolution is better.
Website availability: checking from the outside
External availability monitoring is one of the clearest ways to understand whether visitors can reach a website.
Instead of relying exclusively on internal application information, an independent monitoring process makes requests to the public website.
It can check the response status, connection behavior and whether expected page content is present.
For customer websites, the intended checks should focus on important public URLs rather than requesting every page continuously.
The homepage is an obvious starting point.
Other useful targets may include a contact page, an important service page or an appropriate application-health endpoint.
Checks from more than one network location can also help distinguish a widespread failure from a localized connection problem.
However, multiple monitoring locations don't automatically guarantee that every possible regional issue will be detected.
The purpose is to gather enough reliable evidence to establish whether a website needs attention.
And because monitoring itself can fail, missed checks must be distinguishable from successful checks. A dashboard should never quietly turn an absence of data into a healthy status.
Monitoring the EmDash editor
This is an area where EmDash-specific hosting can provide more useful monitoring than a generic uptime service.
For a content-managed website, the public pages are only part of the application.
The native EmDash editor is also important.
If visitors can read the website but authorized editors can no longer publish content, the service isn't fully healthy.
That doesn't necessarily justify taking the public website offline.
It does justify identifying the problem.
Application-health monitoring checks that the editor-related services respond and looks for failures that affect their use.
Selected functional checks may also verify safe, non-destructive operations where supported.
Monitoring should not repeatedly create content, modify production data or attempt arbitrary administrative actions simply to prove that the editor exists.
Authentication boundaries and customer permissions must remain intact.
A monitoring check should help protect the website.
It shouldn't become another reason the website needs protecting.
Application errors and Cloudflare Workers monitoring
Cloudflare Workers provides observability tools that help operators understand how applications behave.
These include request and execution metrics, historical logs and information about errors.
For DashHarbor, these signals can help distinguish an application failure from a website availability problem.
For example, a Worker may continue handling most requests successfully while a particular operation begins throwing exceptions.
Visitors using unaffected pages might notice nothing.
Customers using the failing feature could experience repeated errors.
Worker-level metrics and logs can help identify that pattern.
Cloudflare also distinguishes between application execution outcomes and HTTP response codes. A Worker successfully returning a response does not, by itself, prove that the application-level result was correct.
That's one reason monitoring should combine infrastructure signals with meaningful website checks.
DashHarbor can use the relevant Cloudflare observability capabilities alongside its own managed health checks, subject to the configuration and retention limits of the underlying services.
Monitoring D1, R2 and the services behind your website
A modern EmDash website depends on more than application code.
Cloudflare D1 may hold pages, posts and structured content. R2 may hold images and uploaded files.
Problems involving either service can affect the website without making every page disappear.
For example, a public page might still load while its images fail. Database-dependent features might return errors even though static parts of the site continue working.
The intended DashHarbor monitoring service uses relevant platform metrics, operational results and safe service checks to help identify these failures.
Database health
Useful database-related signals include failed operations, unexpected application errors and issues connecting to the expected database.
Monitoring can also help identify problems following database migrations or managed application updates.
The objective isn't to run expensive diagnostic queries continuously.
It's to detect meaningful problems without creating an unnecessary burden on the database.
Media availability
An uploaded image might become inaccessible because of a missing object, incorrect reference or storage-related error.
Monitoring can check relevant media paths and investigate storage-operation failures.
This becomes especially useful after updates, migrations or recovery operations that may affect the relationship between content and media.
Domain and HTTPS health
A perfectly functioning application is not much use if visitors cannot reach its domain.
DNS changes, routing problems and HTTPS certificate issues can prevent visitors from accessing a website even when its application and stored data are healthy.
Monitoring should distinguish these connection problems from failures inside EmDash.
That's useful because the appropriate repair is often completely different.
A database restore isn't going to fix a mistyped DNS record.
Alerts should be useful, not noisy
One of the biggest problems with monitoring systems is that they can become very good at telling you things you don't need to know.
A temporary timeout produces an alert.
The next successful request produces a recovery notification.
Another timeout creates a new incident.
Repeat this often enough and customers eventually start ignoring the notifications.
At that point, the monitoring system has defeated its own purpose.
Useful alerts distinguish repeated failures, severity, ongoing incidents and confirmed recovery.
Rather than creating a new alert for every failed request, related events should be grouped where appropriate.
Notification preferences should also allow customers to receive information relevant to them without being overwhelmed.
An unavailable website deserves attention.
One slow response during an otherwise healthy period might deserve recording rather than an immediate email.
A reliable monitoring service knows the difference—or at least makes a serious effort to.
What should a customer monitoring dashboard show?
Most customers don't need raw Cloudflare execution logs.
They need a clear explanation of whether their website is healthy, what has happened recently and whether anything requires attention.
The monitoring dashboard puts that practical information in one place.
The intended customer view includes:
- Current website status: A clear indication of the latest confirmed health state.
- Last successful check: When the relevant monitoring check actually completed.
- Availability history: A useful record of successful and failed checks.
- Active incidents: Problems currently being investigated or awaiting resolution.
- Recent alerts: Important notifications and their outcomes.
- Managed operations: Relevant backup, update and deployment results.
- Incident history: Previous problems, their duration and resolution.
- Notification settings: Customer preferences for monitoring alerts.
The dashboard should distinguish between *healthy*, *degraded*, *unavailable* and *unknown* conditions.
Unknown is particularly important.
If monitoring data stops arriving, the system shouldn't automatically claim that the website is healthy.
That would be like a smoke detector announcing that everything is safe because its batteries died.
Incident history: what happened, and what was done?
A useful monitoring system needs a memory.
Suppose a website becomes unavailable shortly after a managed update.
An alert is generated. An operator investigates, discovers a compatibility issue and restores a working deployment.
The website comes back online.
Good.
But the incident record should still explain what happened.
For example, a customer-facing timeline might look like this:
10:02 — Issue detected
Repeated public website checks report errors.
10:04 — Incident confirmed
The monitoring system records the failure and generates an alert.
10:12 — Investigation underway
The operator identifies a problem associated with a recent deployment.
10:19 — Service restored
A compatible deployment is recovered and the relevant health checks pass.
These times are illustrative, not a guaranteed DashHarbor response schedule.
A real incident record should distinguish between automatically detected events, operator actions and confirmed recovery.
It should also avoid publishing sensitive operational details, credentials or information belonging to other customers.
The result is a useful history rather than a collection of unexplained status changes.
For customers, that provides transparency.
For DashHarbor, it creates a better record for diagnosing recurring problems and improving the service.
Monitoring vs. analytics: aren't they the same thing?
Not quite.
Website analytics tells you how people use your site.
Monitoring tells you whether the site is functioning as expected.
They can complement each other, but they answer different questions.
Capability | Main question it answers | Typical information |
|---|---|---|
Website monitoring | Is the website working? | Availability, errors, health checks and alerts. |
Website analytics | How are visitors using the website? | Traffic, pages viewed, referral sources and conversions. |
Application logs | What happened inside the software? | Request details, exceptions and diagnostic events. |
Incident management | What went wrong and how was it resolved? | Incident timeline, investigation and resolution status. |
Backup and recovery | How can the website be restored? | Recovery points, protected states and restoration outcomes. |
Consider a contact page that suddenly stops working.
Analytics might show a drop in completed inquiries.
Monitoring could identify that the form or relevant application function is failing.
Logs might reveal the underlying exception.
Incident management records the investigation and repair.
Backup or recovery capabilities may provide a way to restore an earlier working state if needed.
Different tools, different jobs.
And together, much more useful than simply staring at a declining conversion chart and wondering what happened.
Can monitoring prevent website downtime?
Monitoring cannot prevent every failure.
It doesn't magically repair broken code, eliminate network outages or guarantee that third-party services will always behave.
What it can do is reduce the amount of time problems go unnoticed.
That's valuable.
A failure detected quickly can be investigated sooner than one discovered several days later.
Monitoring can also identify warning signs, such as growing error rates or repeated failed operations, before a wider failure becomes obvious.
But detection and repair are separate activities.
A monitoring service that finds an incident still needs a suitable operational response.
That might involve fixing a configuration problem, deploying a corrected application version or using a tested recovery procedure.
DashHarbor's managed monitoring approach is intended to work alongside its update and recovery processes, rather than pretending that collecting metrics automatically solves problems.
How monitoring connects to Backups, Recovery and Updates
These features are designed to support one another.
Monitoring identifies the problem.
When an availability check fails or an unusual application error appears, monitoring provides the information needed to begin investigating.
Backups preserve recovery options.
If a problem involves damaged or missing data, suitable recovery points may make it possible to return to an earlier state.
Recovery gets the website working again.
The managed recovery process determines what needs restoring, applies appropriate safeguards and verifies the result.
Updates help maintain the software.
Controlled release reviews, compatibility checks and protected deployments reduce the risk associated with changing the application.
These responsibilities overlap operationally, but they aren't interchangeable.
Monitoring won't replace backups. Backups won't notify you that a website has stopped responding. And a Worker rollback won't automatically restore lost media.
The value comes from operating the website as a connected system.
Explore EmDash Backups, EmDash Recovery and EmDash Updates for the rest of that picture.
What about automatic incident response?
Automatic detection doesn't mean every problem should trigger an automatic repair.
Some failures have straightforward responses. Others require investigation because the wrong corrective action could make things worse.
For example, repeatedly restarting or redeploying an application won't fix every database problem.
Automatically restoring an earlier database state could also discard perfectly valid recent content.
Monitoring combines automated checks, useful alerts and a clear route for investigating problems.
More advanced automatic remediation can be considered for specific, well-understood failure scenarios with tested safeguards.
Destructive recovery operations should remain subject to the necessary controls and approvals.
The goal is useful automation, not a robot enthusiastically making the same mistake every five minutes.
Monitoring without compromising website security
Monitoring needs information about a website's operation, but it shouldn't require unnecessary access to customer content or credentials.
Public availability checks can often work without authentication.
Internal health checks may require protected endpoints or service permissions, but those should be limited to the information needed for the check.
For the native EmDash editor, monitoring needs to respect existing authentication and authorization boundaries.
Operational logs and diagnostic records may also contain information that should not be exposed to other customers.
A multi-customer hosting service needs clear separation between each site's monitoring data and permissions.
Customer dashboards should display only the status, history and operational information they are authorized to see.
Monitoring is supposed to help keep your website healthy.
It shouldn't become a new security problem.
Does monitoring guarantee 100% uptime?
No.
No reasonable monitoring service should promise that a website can never experience downtime.
Monitoring detects problems. It does not eliminate the possibility of failures involving applications, databases, networks, DNS or third-party services.
Cloudflare provides a substantial global infrastructure, but applications running on that infrastructure can still experience errors.
What matters is how availability is measured, how failures are detected and what happens when an incident occurs.
A useful availability report should explain what was checked, how often checks ran and which failures were counted.
Availability measured from periodic checks is also an estimate based on those observations, not proof that every visitor experienced exactly the same result.
DashHarbor's customer-facing monitoring service should publish meaningful measurements rather than unsupported uptime guarantees.
Specific availability commitments, alert frequencies and response targets belong in verified service policies once the monitoring system has been implemented and tested.
Why managed monitoring matters for small businesses
If you're a developer running your own infrastructure, you can configure monitoring services, collect application logs and investigate failures yourself.
That's a perfectly reasonable arrangement.
If you're running a local service business, publishing articles, selling your expertise or generating inquiries from your website, you probably have better things to do.
You shouldn't need to keep checking your homepage to see whether it still exists.
And even if you did, opening the homepage once a day wouldn't tell you whether the rest of the application was healthy.
DashHarbor's managed monitoring offering is intended to make website health part of the hosting service.
The customer gets useful information about the website's status.
DashHarbor gets the operational signals needed to identify and investigate hosting problems.
And neither side has to pretend that a green light on a dashboard is meaningful unless an actual check produced it.
That's the point of monitoring.
Not more graphs.
Fewer unpleasant surprises.
Frequently asked questions
Does DashHarbor monitor my EmDash website?
DashHarbor already checks the health of its hosting platform. Customer-specific monitoring, configurable alerts and status history are coming soon with paid hosting.
Will DashHarbor notify me if my website goes down?
Customer notifications flag confirmed availability problems and important application failures through supported channels. They are part of the Coming soon monitoring service.
Can monitoring detect problems even when my homepage loads?
Yes, when the appropriate functional and application-health checks are configured. A successful homepage response does not guarantee that the editor, media, database-dependent functions or other important services are working. DashHarbor's expanded monitoring design includes checking relevant application behavior rather than relying on basic uptime alone.
Does DashHarbor automatically fix problems detected by monitoring?
Monitoring and recovery are separate operations. Monitoring detects and reports problems, while investigation determines the appropriate corrective action. DashHarbor's managed procedures support controlled updates and recovery operations. Automatic remediation may be introduced for specific tested scenarios, but potentially destructive repairs require suitable safeguards and review.
Can I see my website's uptime and incident history?
The monitoring dashboard brings together availability history, recent checks, alerts and incident records. You can follow your website's health without reading raw Cloudflare logs.
Is EmDash Monitoring included in the free DashHarbor plan?
Platform health checks are part of running DashHarbor, including free websites. Customer-specific monitoring, alert preferences and incident history are coming soon with paid hosting.
Your website should tell us when something's wrong
A website doesn't need constant attention from its owner.
It does need somebody to notice when important things stop working.
DashHarbor's managed monitoring service is designed to connect website availability, application-health checks, alerts and incident history into a clearer picture of your hosted EmDash site.
The objective is simple: identify problems early, make the information useful and support a controlled response when something needs fixing.
You concentrate on publishing content and running your business.
We'll concentrate on making website health easier to monitor and manage.
Because your customers shouldn't have to become your monitoring system.
Paid subscriptions aren't open yet. Start building for free on your DashHarbor subdomain.
Start with a real EmDash site
Create your free website on DashHarbor and publish using the native EmDash editor. Explore the platform now, with expanded managed monitoring forming part of the paid hosting offering.
Explore related features
- EmDash Backups — Protect content, media and deployment state with managed recovery points.
- EmDash Recovery — Get your website working again after a failure.
- EmDash Updates — Keep EmDash maintained with controlled updates and compatibility checks.
- EmDash DNS — Understand how your domain connects to your hosted website.